Happiness Poll: Democrats, Biden Voters Report More Happiness Than GOP
Voters of the Democratic party and U.S. President Joe Biden are happier than voters for the Republican party, according to a new ČČM┼«Ų═ PolCom and Mainstreet Research happiness poll.
Voters of the Democratic party and U.S. President Joe Biden are happier than voters for the Republican party and former U.S. President Donald Trump, while older and wealthier adult voters are happier than younger and less-wealthy ones, according to a new ČČM┼«Ų═ PolCom and Mainstreet Research happiness poll released today in advance of the United NationŌĆÖs International Day of Happiness on March 20.
ŌĆ£Happiness is important to understand as it influences the well-being and satisfaction of citizens, which in turn shapes their voting behavior,ŌĆØ said Carol Bishop Mills, Ph.D., ČČM┼«Ų═ŌĆÖs communication professor, PolCom co-director, and expert in relational communication. ŌĆ£As demonstrated by Ronald ReaganŌĆÖs enduring question in the 1980 presidential election, ŌĆśAre you better off today than you were four years ago?ŌĆÖ capturing public sentiment toward governance and policy efficacy is critical ŌĆō especially in todayŌĆÖs contentious political climate.ŌĆØ
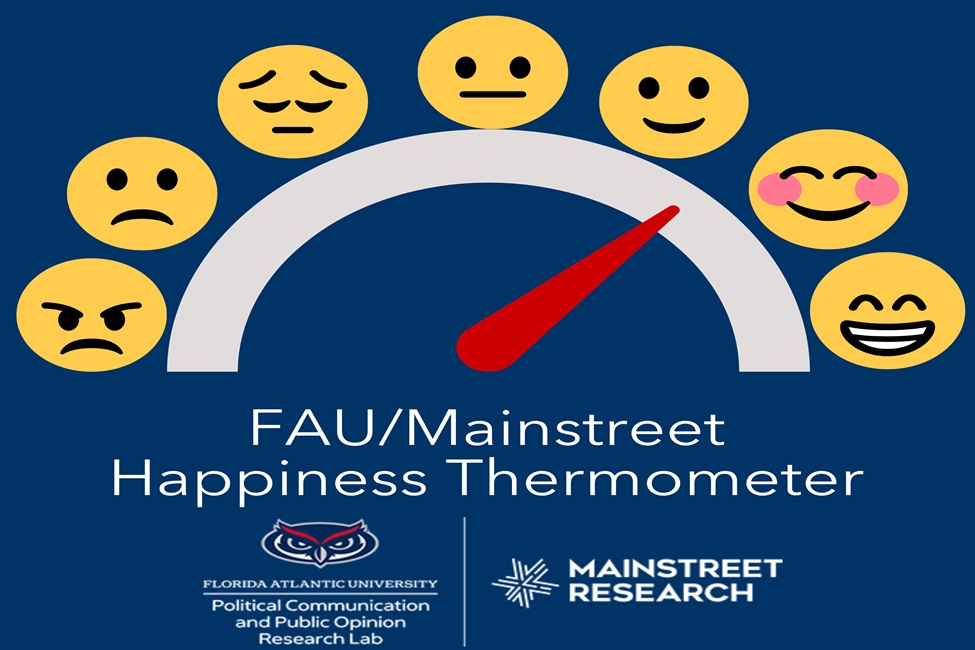
The Happiness Thermometer poll employed the well-established ŌĆ£Satisfaction with Life Scale,ŌĆØ developed by Ed Diener, et. al (1985), which uses five items that are designed to assess overall happiness. Through its application in the poll, the thermometer measures connections between happiness and politics, revealing measurable differences in happiness among age and economic groups, as well as party affiliation and voter intention.
Among the findings: 69 percent of Democratic voters reported theyŌĆÖre at least ŌĆ£slightly satisfiedŌĆØ with their lives, while 66 percent of Republican respondents said they were so. Among voters who would vote for Biden in 2024, 75 percent answered that they were at least ŌĆ£slightly satisfiedŌĆØ with their lives, while 62 percent of Trump voters said the same.
ŌĆ£This pattern highlights the importance of happiness not just as a personal pursuit but as an important predictor of voting behavior that harks back to Ronald ReaganŌĆÖs 1980s question,ŌĆØ Mills said. ŌĆ£As seen in the connections between happiness and political intention, people who are content are more likely to support incumbents than people who do not feel happy.ŌĆØ
The Kids are not Alright: People are Happy Overall; Younger People ArenŌĆÖt
In line with prevailing research in the field, most individuals surveyed reported a sense of contentment: 66 percent of respondents expressed satisfaction with their lives, with 22 percent reporting that they were ŌĆ£extremely satisfied;ŌĆØ 25 percent who were ŌĆ£satisfied;ŌĆØ and 19 percent who were ŌĆ£slightly satisfied.ŌĆØ Eighty-nine percent of people over 65 and nearly 67 percent of people ages 50 to 64 reported being ŌĆ£happy.ŌĆØ
But not all news is good. Roughly 56 percent of younger respondents 18 to 34 (millennials and Generation Z) indicated that they were ŌĆ£dissatisfiedŌĆØ with their lives, and only 21 percent of this age group indicated that they were ŌĆ£extremely satisfiedŌĆØ or ŌĆ£satisfied.ŌĆØ According to the poll, 49 percent voted Democrat in the 2020 presidential election and 42 percent voted Republican.
This response indicates that respondentsŌĆÖ voter intentions mirror their emotional state. Reversing their previous voting behavior in the 2024 presidential election, 54 percent of likely voters in this age group indicated they would vote for Trump, while only 37 percent reported that they would vote for Biden. Among all voters in this age group, 50 percent indicated they would vote for Trump and 34 percent indicated they would vote for Biden.
ŌĆ£This finding is important. Generally, young adults through the early 30s have high levels of happiness, bolstered by optimism, new experiences and independence. Then, happiness dips for mid-life periods and rebounds with the highest levels in adults over 50,ŌĆØ Mills said. ŌĆ£Young people with high levels of unhappiness is noteworthy ŌĆō and so is the level of satisfaction among older voters. We have seen a rise in depression, anxiety and mental health issues in the younger population, and it is important to take these concerns seriously.ŌĆØ
Demographic Variations Matter (in Happiness and Politics): Race, Income and Education
Meaningful disparities in candidate support emerged across various demographic factors. Although it is said that money canŌĆÖt buy happiness, the data demonstrates that in some ways, it does. Of respondents making $50,000 or less, 62 percent indicated that they are happy, but 72 percent of respondents with incomes of more than $100,000 reported that they are happy. Economic dissatisfaction may be translating into support for Trump, as 50 percent of people making under $50,000 support Trump and 55 percent making over $100,000 support Biden.
Interestingly in terms of race and ethnicity, white voters emerged as the group exhibiting the highest levels of life satisfaction, with a striking 70 percent indicating at least slight satisfaction. Meanwhile, Black voters demonstrated a satisfaction rate of 60 percent, while Hispanic voters reported 61 percent satisfaction.
ŌĆ£Inscribed in the Declaration of Independence is that the pursuit of happiness is a fundamental right,ŌĆØ said Luzmarina Garcia, Ph.D., assistant professor of political science at ČČM┼«Ų═. ŌĆ£But when we look at data, itŌĆÖs clear that people from different races and ethnicities donŌĆÖt always have the same levels of happiness in modern-day America.ŌĆØ
Tight Presidential Contest Unfolds: Biden and Trump Locked, but Biden Gains
The ČČM┼«Ų═/Mainstreet poll also reveals a neck-and-neck competition between Biden and Trump in the forthcoming presidential elections, both among all voters and likely voters.
In response to the question, ŌĆ£If the election for president was held today, and candidates were Joe Biden and Donald Trump, which candidate would you support?ŌĆØ voters demonstrated a striking split in their preferences, with 44 percent expressing support for Biden and 44 percent for Trump. Similarly, among likely voters, Biden slightly edged out Trump with 47 percent of support compared to TrumpŌĆÖs 45 percent.
ŌĆ£This difference falls within the margin of sampling error, rendering the presidential race too close to predict a definitive winner at this stage. Notably, a mere 4 percent of undecided likely voters underscore the tightness of the election,ŌĆØ said Dukhong Kim, Ph.D., associate professor of political science at ČČM┼«Ų═.
Comparing these findings to the February poll, Biden has marginally improved his chances of securing victory. In February, he trailed Trump by 4 percent, indicating a subtle shift in voter sentiment within just a month. Additionally, the proportion of undecided voters has dwindled from 9 percent in February to 4 percent in March, further highlighting the competitiveness of the race.
The analysis is based on the results of a survey conducted Wednesday, March 15 to Friday, March 17 with a sample of 1,053 adults, 18 years of age or older, registered to vote, and living in the United States. The survey was conducted using text message recruitment and interactive voice response to complete the survey. The margin of error for the poll is +/- 3.0 percent at the 95 percent confidence level. Margins of error are higher in each subsample.
To view the poll and report, ┬Ā. For more information on ČČM┼«Ų═ŌĆÖs PolComLab, visit .-ČČM┼«Ų═-
Tags: research | arts and letters